First of all, I have to say THANK YOU for the amazing statistics of those of you who have signed up for my new newsletter. Over 200 people have signed up in just 3 days and that astounds me! Sign ups are open at all times and I am adding the button in the side bar for anyone interested.
Secondly, I would LOVE to see your Flippable creations! I am working on creating a gallery of ideas and would love to feature yours! Each of you work hard to create something great in your classroom
Now… without further ado… samples from the Statistics Interactive Notebook bundle for 6th grade…
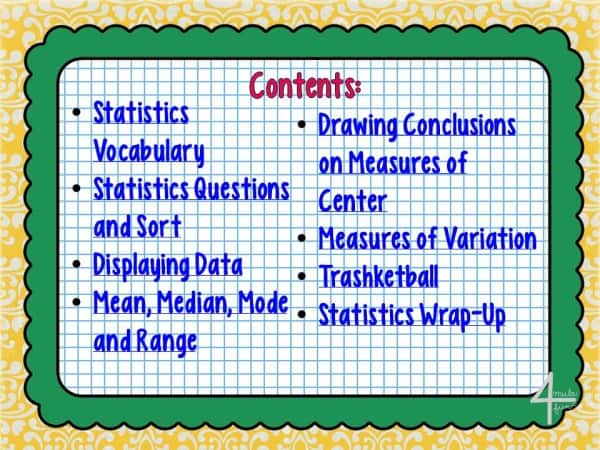
There are a total of 7 different lesson in this unit that are PACKED with Interactive goodness! 🙂
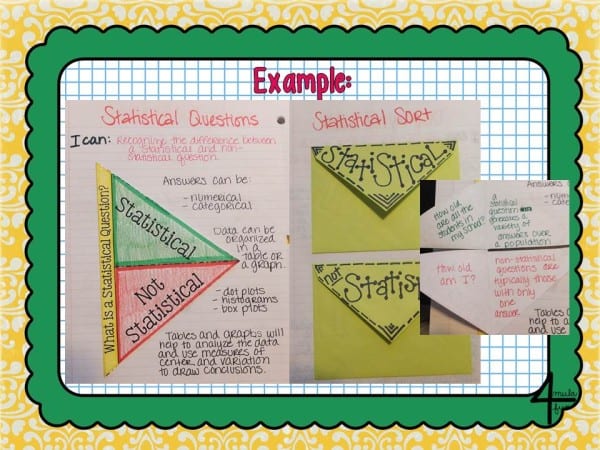
The unit begins with a lesson on statistical questions and a sort where students can choose between questions being statistical or not statistical.
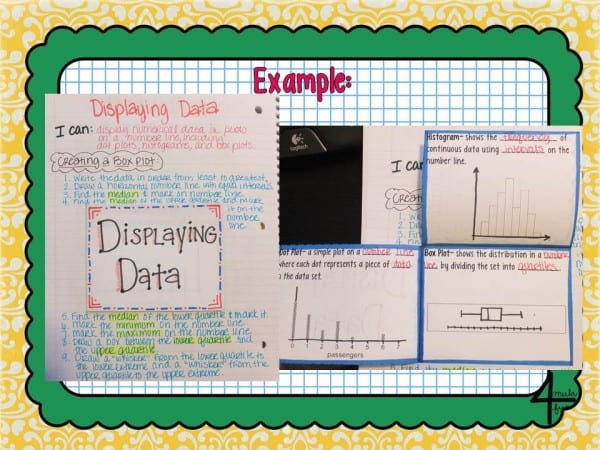
Introducing ways to display data is important as many of these are new to 6th graders. It is also important to take time in this section to go through the steps in creating a Box Plot. Let students highlight the words that are important to them!
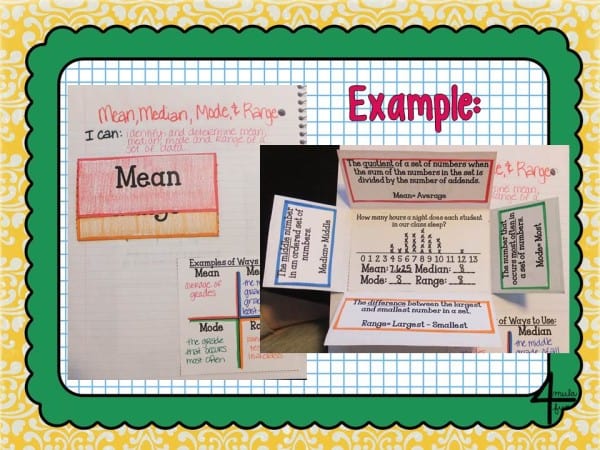
This flippable is on of my first flippables I ever created but I still love it! Mean, Median, Mode and Range happens to be one of my favorite things to teach and what my students have always loved to learn.
Continuing after learning about creating Box Plots, students need to understand the difference in Upper Quartiles, Lower Quartiles and the Interquartile Range.

This is just a taste of the greatness that is found in this Interactive Notebook Pack for Statistics. While this unit is aligned for Common Core State Standards 6.SP.1, 6.SP.2, 6.SP.3 and 6.SP.4 it also aligns quite nicely with the new TEKS for 6th grade- 6.12a, 6.12b, 6.12c, 6.12d, 6.13a and 6.13b.
Teach Me About Math Workshop!
Looking for all the latest about using Math Workshop in the Middle Grades? Join today and grab the FREE Editable Math Workshop Sheets and all of the great emails to come your way!
Success! Now check your email to confirm your subscription.


